Edit chart
Loading graph
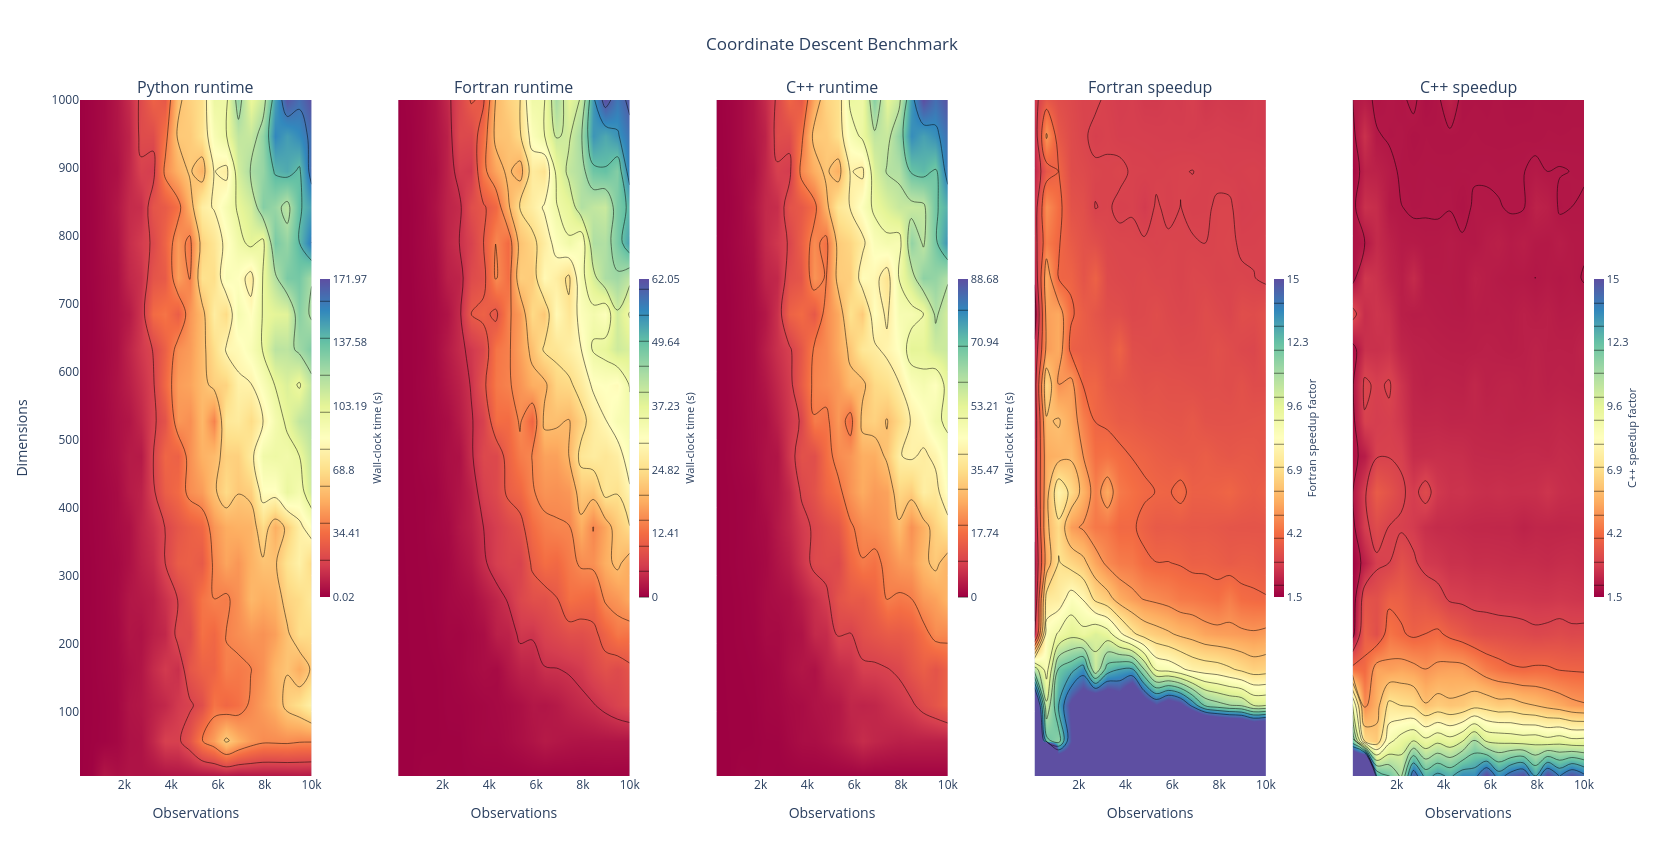
Bubald's interactive graph and data of "Coordinate Descent Benchmark" is a contour; with Observations in the x-axis and Dimensions in the y-axis.. The x-axis shows values from 0 to 0. The y-axis shows values from 0 to 0. This visualization has the following annotations: Python runtime; Fortran runtime; C++ runtime; Fortran speedup; C++ speedup