Edit chart
Loading graph
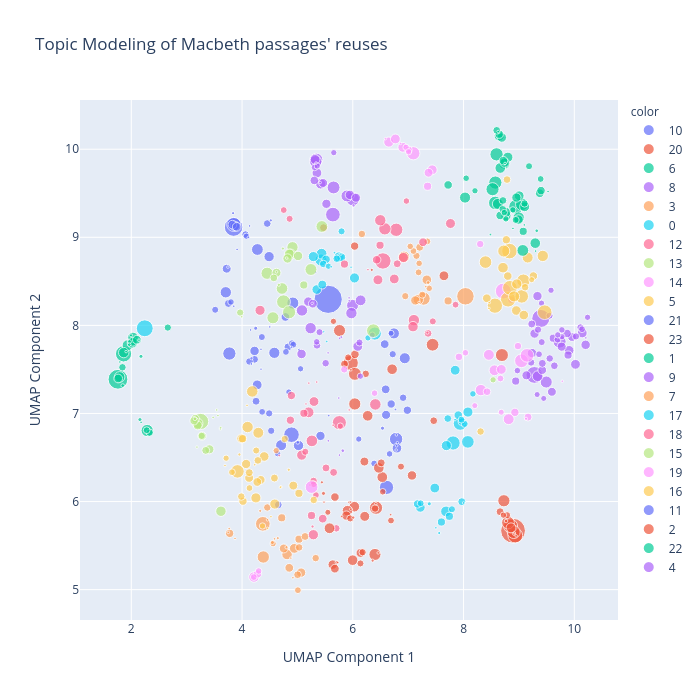
Bruceng's interactive graph and data of "Topic Modeling of Macbeth passages' reuses" is a scatter chart, showing 10, 20, 6, 8, 3, 0, 12, 13, 14, 5, 21, 23, 1, 9, 7, 17, 18, 15, 19, 16, 11, 2, 22, 4; with UMAP Component 1 in the x-axis and UMAP Component 2 in the y-axis.. The x-axis shows values from 0 to 0. The y-axis shows values from 0 to 0.