Edit chart
Loading graph
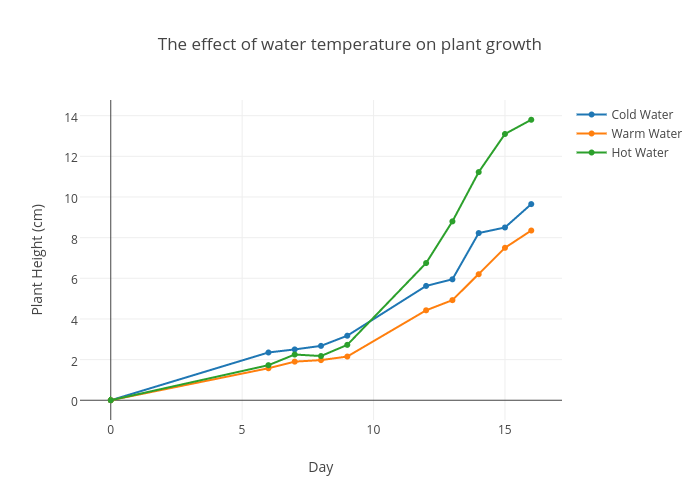
Brownk19's interactive graph and data of "The effect of water temperature on plant growth" is a scatter chart, showing Cold Water, Warm Water, Hot Water; with Day in the x-axis and Plant Height (cm) in the y-axis.. The x-axis shows values from -0.9702293801854563 to 16.970229380185458. The y-axis shows values from -0.9628454452405322 to 14.762845445240533.