Edit chart
Loading graph
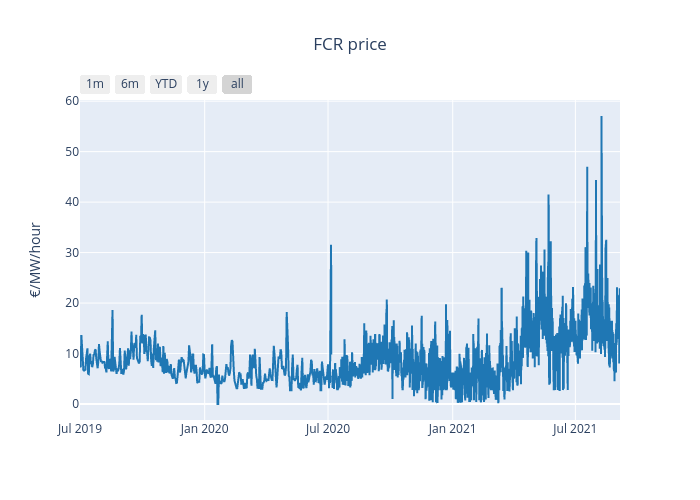
Bmenu's interactive graph and data of "FCR price" is a line chart, showing FR; with time in the x-axis and €/MW/hour in the y-axis.. The x-axis shows values from 0 to 0. The y-axis shows values from 0 to 0.