Edit chart
Loading graph
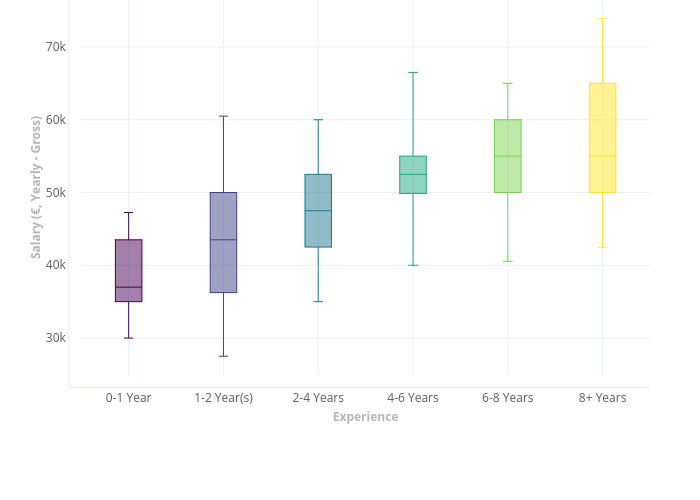
Bkantar's interactive graph and data of "Salary (€, Yearly - Gross) vs Experience" is a box plot, showing 0-1 Year, 1-2 Year(s), 2-4 Years, 4-6 Years, 6-8 Years, 8+ Years; with Experience in the x-axis and Salary (€, Yearly - Gross) in the y-axis.. The x-axis shows values from -0.5 to 5.5. The y-axis shows values from 24923.61111111111 to 76451.38888888889.