Edit chart
Loading graph
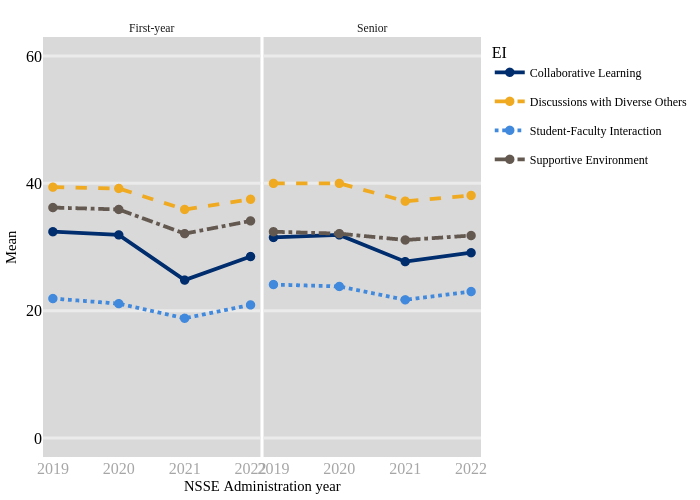
Bjdugan91's interactive graph and data of "{'font': {'size': 16}}" is a line chart, showing Collaborative Learning, Collaborative Learning, Discussions with Diverse Others, Discussions with Diverse Others, Student-Faculty Interaction, Student-Faculty Interaction, Supportive Environment, Supportive Environment. The x-axis shows values from 2018.85 to 2022.15. The y-axis shows values from -3 to 63. This visualization has the following annotations: NSSE Administration year; Mean; First-year; Senior