Edit chart
Loading graph
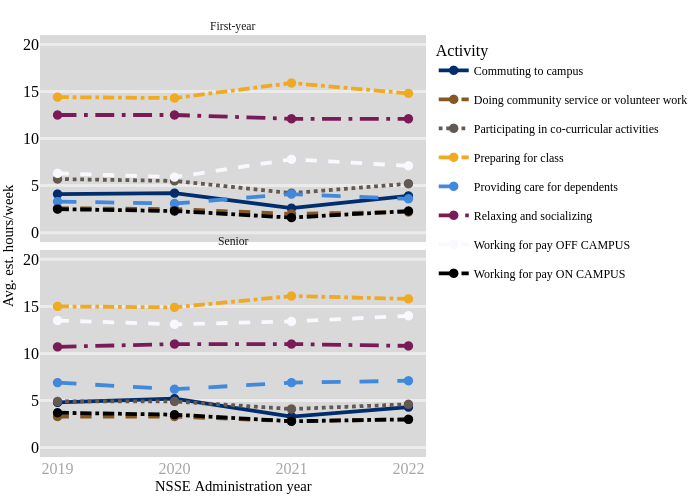
Bjdugan91's interactive graph and data of "{'font': {'size': 16}}" is a line chart, showing Commuting to campus, Commuting to campus, Doing community service or volunteer work, Doing community service or volunteer work, Participating in co-curricular activities, Participating in co-curricular activities, Preparing for class, Preparing for class, Providing care for dependents, Providing care for dependents, Relaxing and socializing, Relaxing and socializing, Working for pay OFF CAMPUS, Working for pay OFF CAMPUS, Working for pay ON CAMPUS, Working for pay ON CAMPUS. The x-axis shows values from 2018.85 to 2022.15. The y-axis shows values from -1 to 21. This visualization has the following annotations: NSSE Administration year; Avg. est. hours/week; First-year; Senior