Edit chart
Loading graph
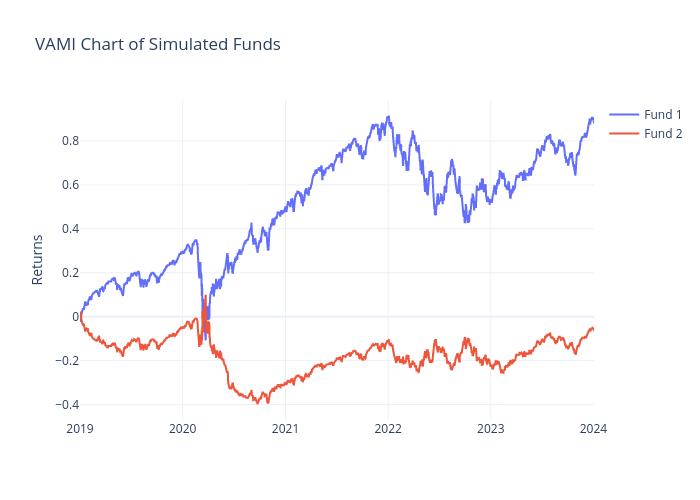
Bingch's interactive graph and data of "VAMI Chart of Simulated Funds" is a line chart, showing %{meta.columnNames.y} vs %{meta.columnNames.y}; with time in the x-axis and Returns in the y-axis.. The x-axis shows values from 2019-01-01 to 2024-01-03. The y-axis shows values from -0.4699955434022465 to 0.9861906445387643.