Edit chart
Loading graph
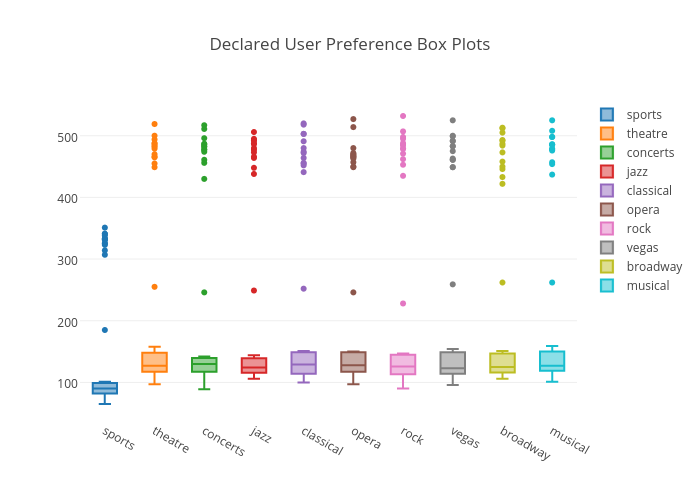
Bill_chambers's interactive graph and data of "Declared User Preference Box Plots" is a box plot, showing sports, theatre, concerts, jazz, classical, opera, rock, vegas, broadway, musical. The x-axis shows values from 0 to 0. The y-axis shows values from 0 to 0.