Edit chart
Loading graph
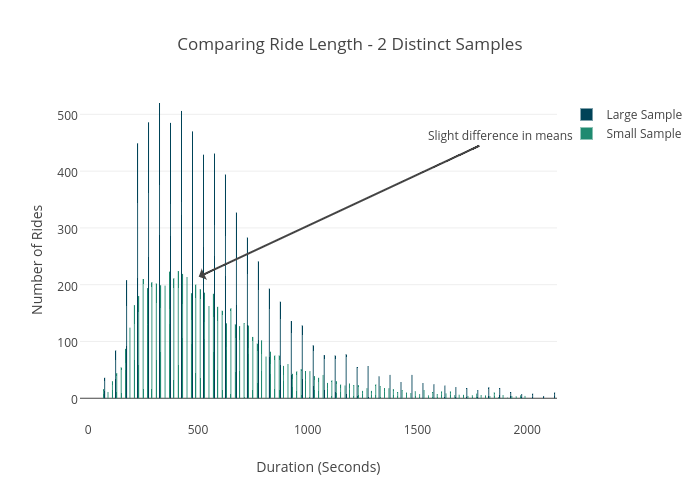
Bill_chambers's interactive graph and data of "Comparing Ride Length - 2 Distinct Samples" is a histogram, showing Large Sample vs Small Sample; with Duration (Seconds) in the x-axis and Number of Rides in the y-axis.. The x-axis shows values from -38.069085084874786 to 2135.287382845111. The y-axis shows values from -38.30701358470006 to 525.2884824501118. This visualization has the following annotation: Slight difference in means