Edit chart
Loading graph
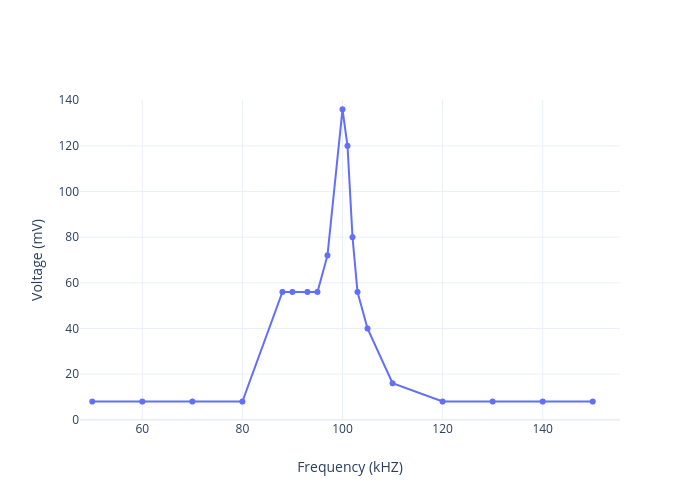
Bhagyawije's interactive graph and data of "Voltage (mV) vs Frequency (kHZ)" is a ; with Frequency (kHZ) in the x-axis and Voltage (mV) in the y-axis.. The x-axis shows values from 47.55325232308792 to 155.44674767691208. The y-axis shows values from -0.08252427184465905 to 140.08252427184465.