Edit chart
Loading graph
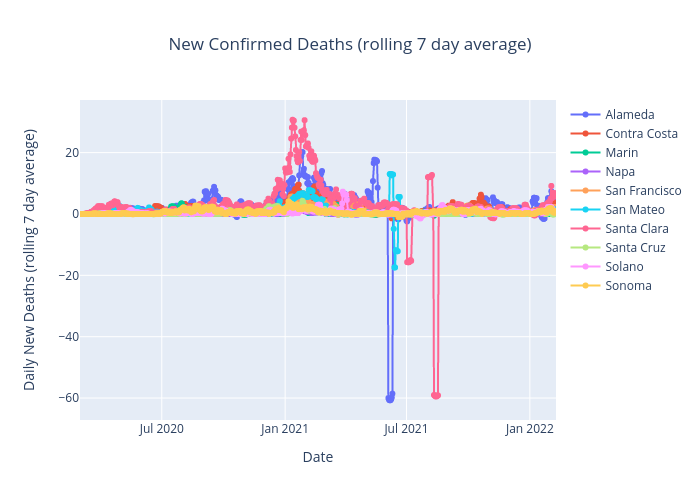
Benhsia's interactive graph and data of "New Confirmed Deaths (rolling 7 day average)" is a , showing Alameda, Contra Costa, Marin, Napa, San Francisco, San Mateo, Santa Clara, Santa Cruz, Solano, Sonoma; with Date in the x-axis and Daily New Deaths (rolling 7 day average) in the y-axis.. The x-axis shows values from 2020-03-01 to 2022-02-09. The y-axis shows values from 0 to 0.