Edit chart
Loading graph
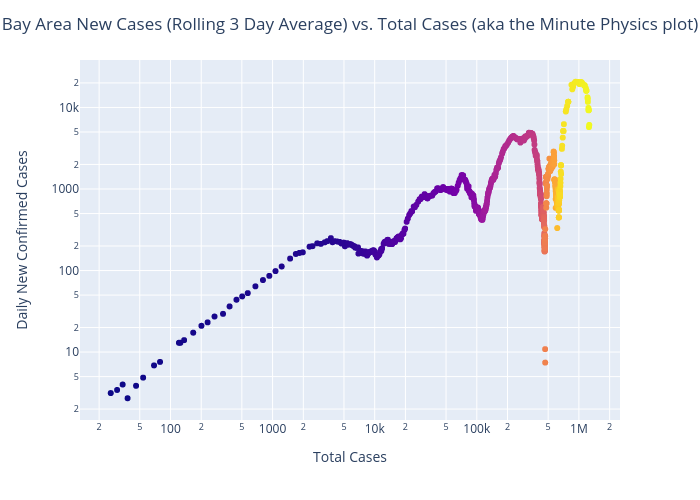
Benhsia's interactive graph and data of "Bay Area New Cases (Rolling 3 Day Average) vs. Total Cases (aka the Minute Physics plot)" is a scatter chart; with Total Cases in the x-axis and Daily New Confirmed Cases in the y-axis.. The x-axis shows values from 0 to 0. The y-axis shows values from 0 to 0.