Edit chart
Loading graph
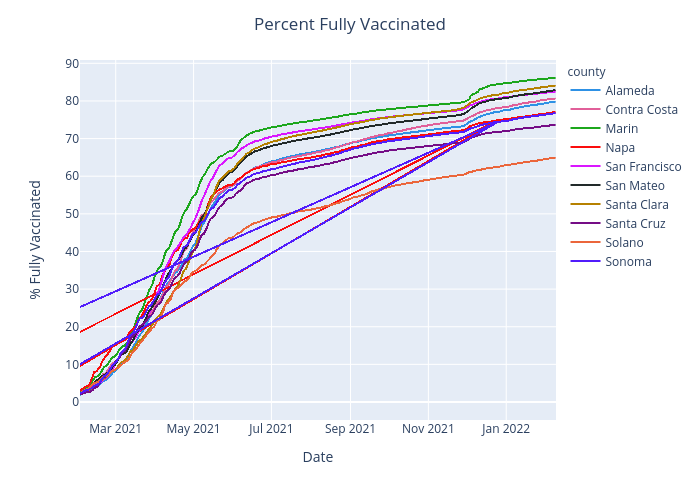
Benhsia's interactive graph and data of "Percent Fully Vaccinated" is a scattergl, showing Alameda, Contra Costa, Marin, Napa, San Francisco, San Mateo, Santa Clara, Santa Cruz, Solano, Sonoma; with Date in the x-axis and % Fully Vaccinated in the y-axis.. The x-axis shows values from 2021-02-01T00:00:00 to 2022-02-09. The y-axis shows values from 0 to 0.