Edit chart
Loading graph
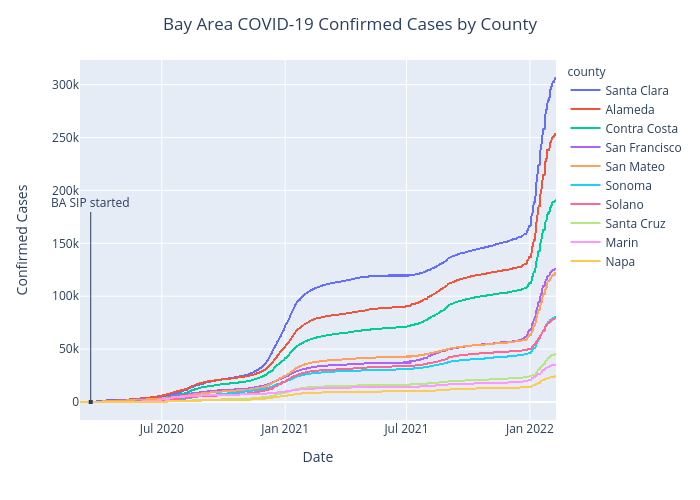
Benhsia's interactive graph and data of "Bay Area COVID-19 Confirmed Cases by County" is a scattergl, showing Santa Clara, Alameda, Contra Costa, San Francisco, San Mateo, Sonoma, Solano, Santa Cruz, Marin, Napa; with Date in the x-axis and Confirmed Cases in the y-axis.. The x-axis shows values from 2020-03-01T00:00:00 to 2022-02-09. The y-axis shows values from 0 to 0. This visualization has the following annotation: BA SIP started