Edit chart
Loading graph
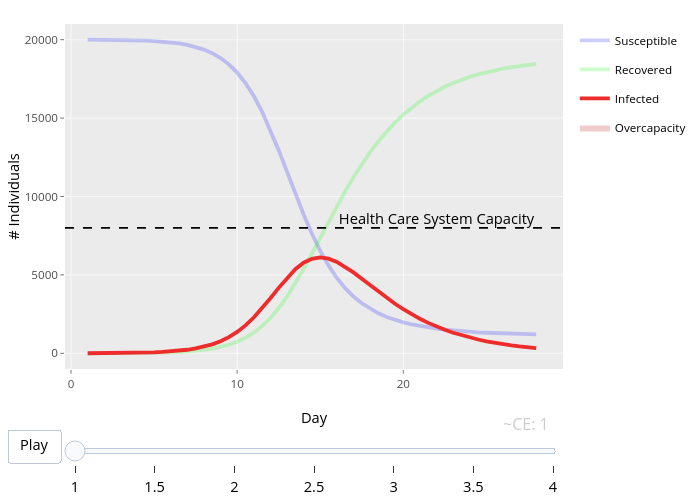
Bcollins92's interactive graph and data of "# Individuals vs Day" is a line chart, showing Susceptible, Recovered, Infected, Overcapacity; with Day in the x-axis and # Individuals in the y-axis.. The x-axis shows values from -0.3625 to 29.6125. The y-axis shows values from -1000 to 21000.