Edit chart
Loading graph
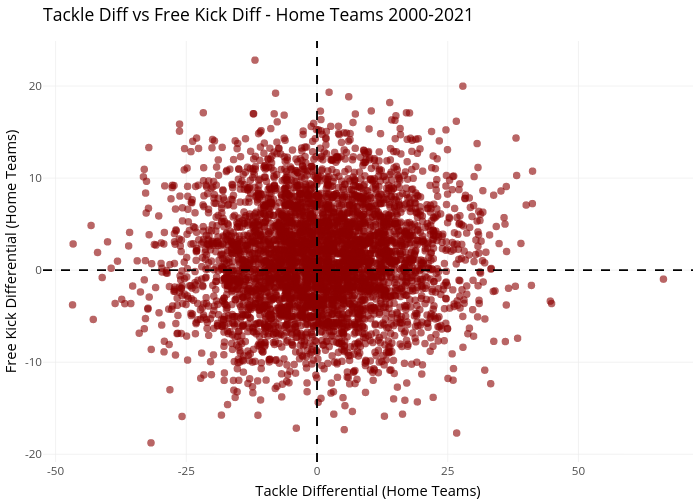
Awalls's interactive graph and data of "Tackle Diff vs Free Kick Diff - Home Teams 2000-2021" is a scatter chart; with Tackle Differential (Home Teams) in the x-axis and Free Kick Differential (Home Teams) in the y-axis.. The x-axis shows values from -52.4084543892555 to 71.907911312338. The y-axis shows values from -20.8388947664294 to 24.8930354156066.