Edit chart
Loading graph
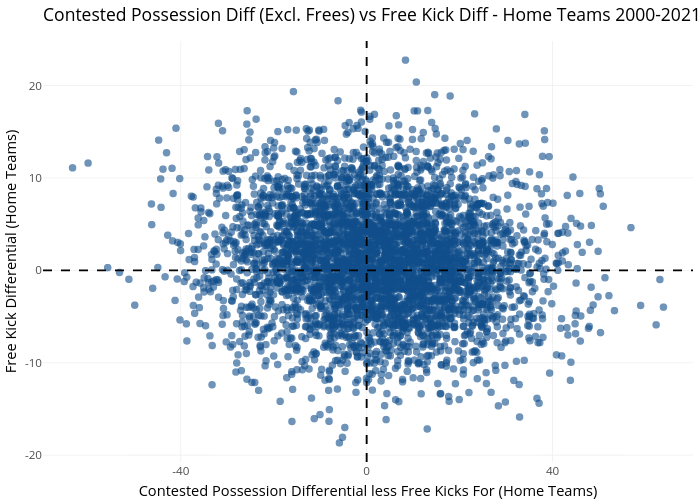
Awalls's interactive graph and data of "Contested Possession Diff (Excl. Frees) vs Free Kick Diff - Home Teams 2000-2021" is a scatter chart; with Contested Possession Differential less Free Kicks For (Home Teams) in the x-axis and Free Kick Differential (Home Teams) in the y-axis.. The x-axis shows values from -69.6472587341256 to 70.2236927809007. The y-axis shows values from -20.7409398036357 to 24.8175994061213.