Edit chart
Loading graph
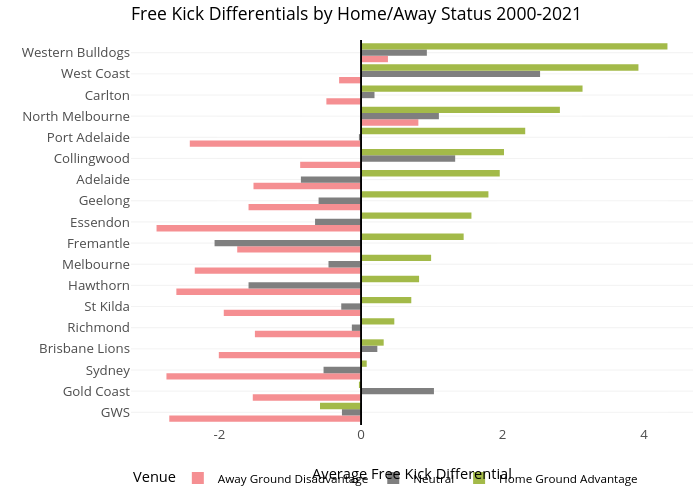
Awalls's interactive graph and data of "Free Kick Differentials by Home/Away Status 2000-2021" is a , showing Away Ground Disadvantage, Neutral, Home Ground Advantage; with Average Free Kick Differential in the x-axis. The x-axis shows values from -3.251 to 4.691. The y-axis shows values from 0.4 to 18.6. This visualization has the following annotation: Venue