Edit chart
Loading graph
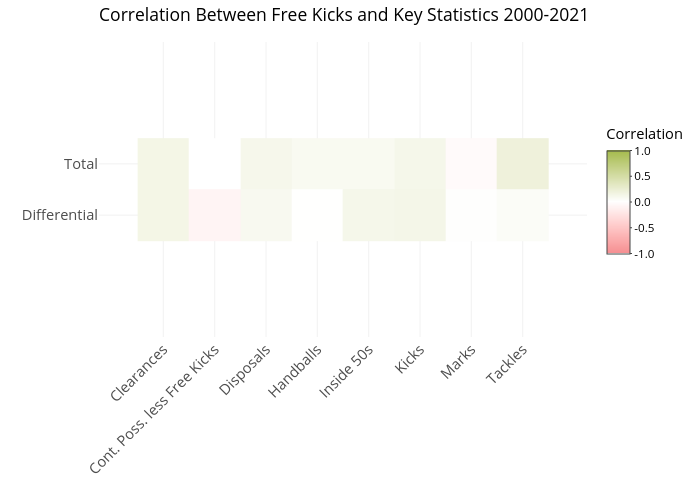
Awalls's interactive graph and data of "Correlation Between Free Kicks and Key Statistics 2000-2021" is a heatmap, showing 99_8835e3f4e170c158d160525f9cad6ef9. The x-axis shows values from 0.4 to 8.6. The y-axis shows values from 0.4 to 2.6.