Edit chart
Loading graph
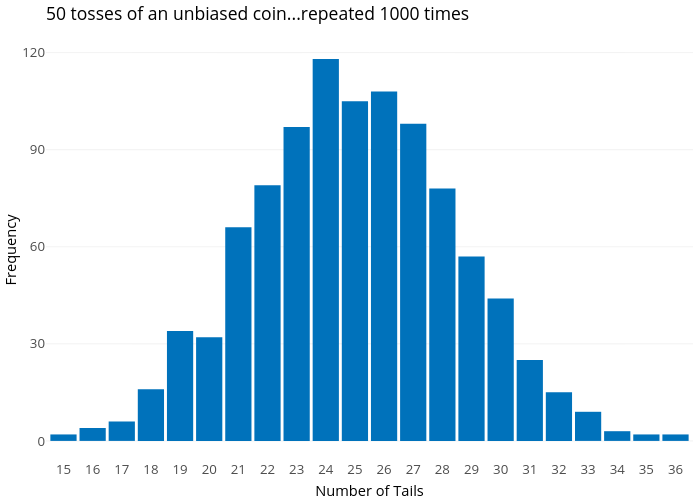
Awalls's interactive graph and data of "50 tosses of an unbiased coin...repeated 1000 times" is a ; with Number of Tails in the x-axis and Frequency in the y-axis.. The x-axis shows values from 0.4 to 22.6. The y-axis shows values from -5.9 to 123.9.