Edit chart
Loading graph
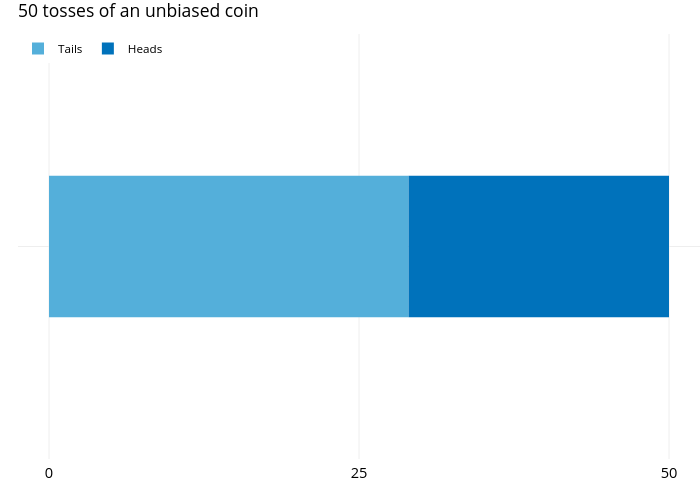
Awalls's interactive graph and data of "50 tosses of an unbiased coin" is a , showing Tails vs Heads. The x-axis shows values from -2.5 to 52.5. The y-axis shows values from 0.4 to 1.6. This visualization has the following annotation: Outcome