Edit chart
Loading graph
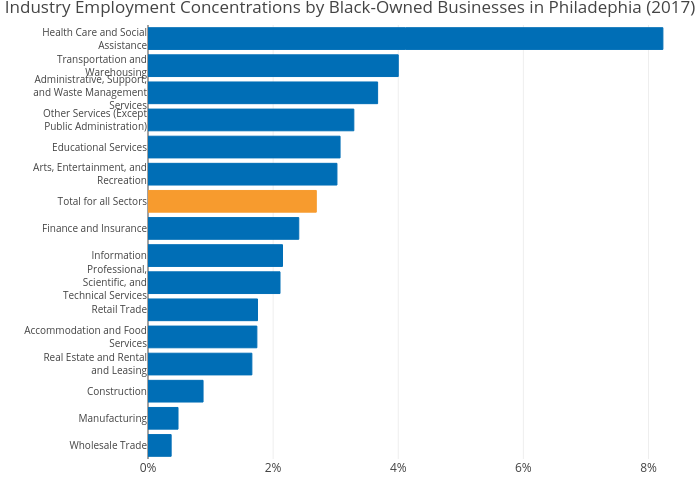
Astrohmetz's interactive graph and data of "Industry Employment Concentrations by Black-Owned Businesses in Philadephia (2017)" is a bar chart. The x-axis shows values from 0 to 0. The y-axis shows values from 0 to 0.