Edit chart
Loading graph
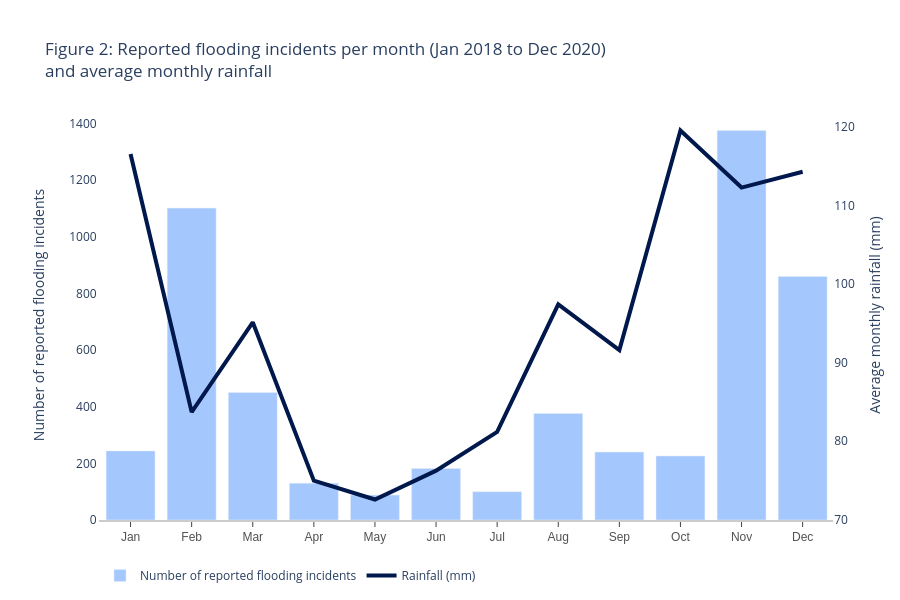
Astennett's interactive graph and data of "Figure 2: Reported flooding incidents per month (Jan 2018 to Dec 2020)and average monthly rainfall" is a bar chart, showing Number of reported flooding incidents vs Rainfall (mm); with Number of reported flooding incidents in the y-axis. The x-axis shows values from 0 to 0. The y-axis shows values from 0 to 0.