Edit chart
Loading graph
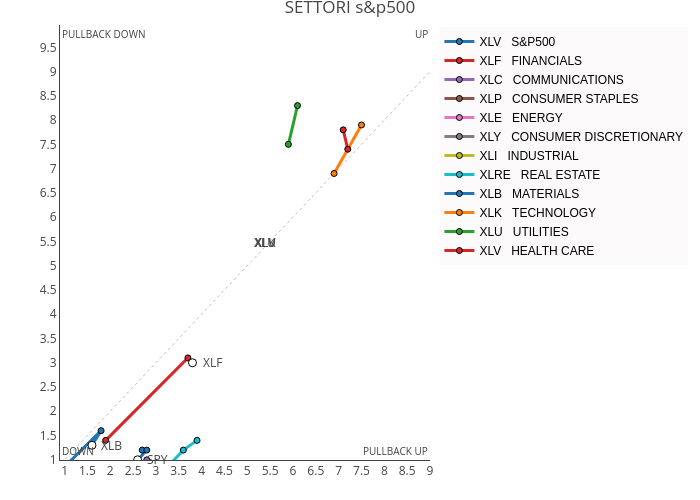
Ashramlv77's interactive graph and data of "SETTORI s&p500" is a line chart, showing XLV S&P500, MT=BT, -MT=BT, XLF FINANCIALS, XLC COMMUNICATIONS, XLP CONSUMER STAPLES, XLE ENERGY, XLY CONSUMER DISCRETIONARY, XLI INDUSTRIAL, XLRE REAL ESTATE, XLB MATERIALS, XLK TECHNOLOGY, XLU UTILITIES, XLV HEALTH CARE, SPY, XLF, XLC, XLP, XLE, XLY, XLI, XLRE, XLB, XLK, XLU, XLV; with [] in the x-axis and [] in the y-axis.. The x-axis shows values from None to 9. The y-axis shows values from None to 9.96. This visualization has the following annotations: UP; DOWN; PULLBACK UP; PULLBACK DOWN; SPY; XLF; XLC; XLP; XLE; XLY; XLI; XLRE; XLB; XLK; XLU; XLV