Edit chart
Loading graph
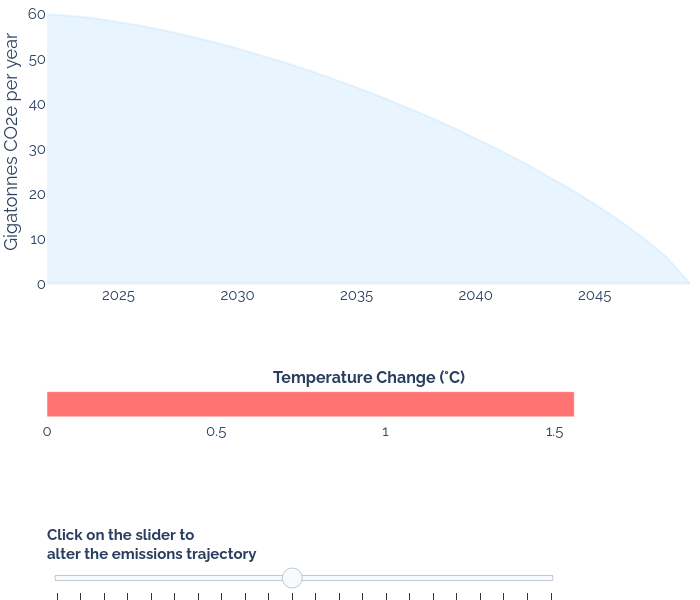
Archy.deberker's interactive graph and data of "{'pad': {'b': 55}}" is a filled scatter chart; with Gigatonnes CO2e per year in the y-axis. The x-axis shows values from 0 to 0. The y-axis shows values from 0 to 0. This visualization has the following annotations: Emissions; Temperature Change (°C)