Edit chart
Loading graph
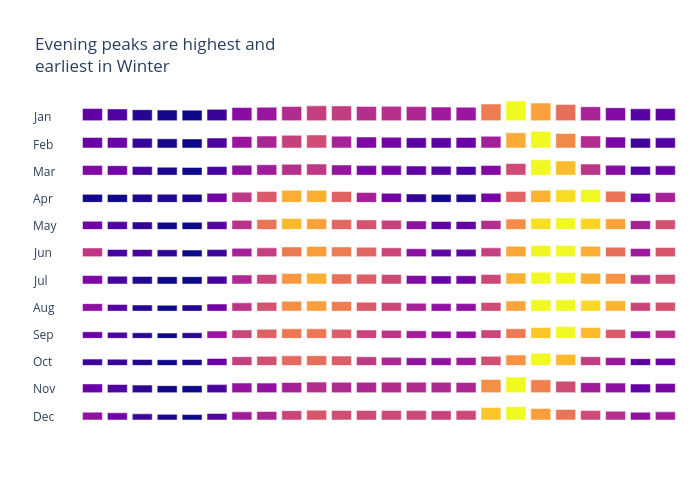
Archy.deberker's interactive graph and data of "Evening peaks are highest and earliest in Winter" is a , showing , , , , , , , , , , , ; with Hour in the x-axis and Day Ahead Price £/MWh in the y-axis.. The x-axis shows values from 0 to 0. The y-axis shows values from 0 to 0. This visualization has the following annotations: Dec; Nov; Oct; Sep; Aug; Jul; Jun; May; Apr; Mar; Feb; Jan