Edit chart
Loading graph
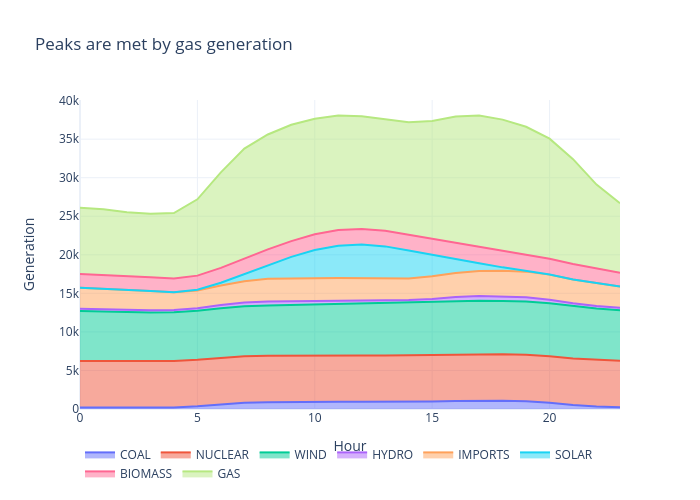
Archy.deberker's interactive graph and data of "Peaks are met by gas generation" is a line chart, showing COAL, NUCLEAR, WIND, HYDRO, IMPORTS, SOLAR, BIOMASS, GAS; with Hour in the x-axis and Generation in the y-axis.. The x-axis shows values from 0 to 0. The y-axis shows values from 0 to 0.