Edit chart
Loading graph
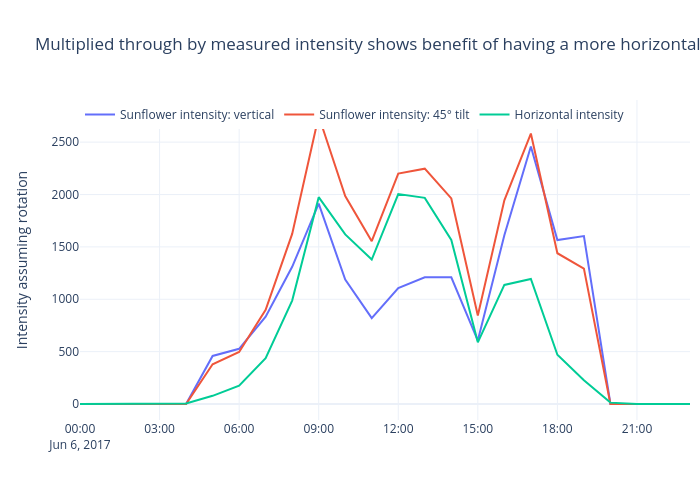
Archy.deberker's interactive graph and data of "Multiplied through by measured intensity shows benefit of having a more horizontal panel" is a line chart, showing Sunflower intensity: vertical, Sunflower intensity: 45° tilt, Horizontal intensity; with {} in the x-axis and Intensity assuming rotation in the y-axis.. The x-axis shows values from 0 to 0. The y-axis shows values from 0 to 0.