Edit chart
Loading graph
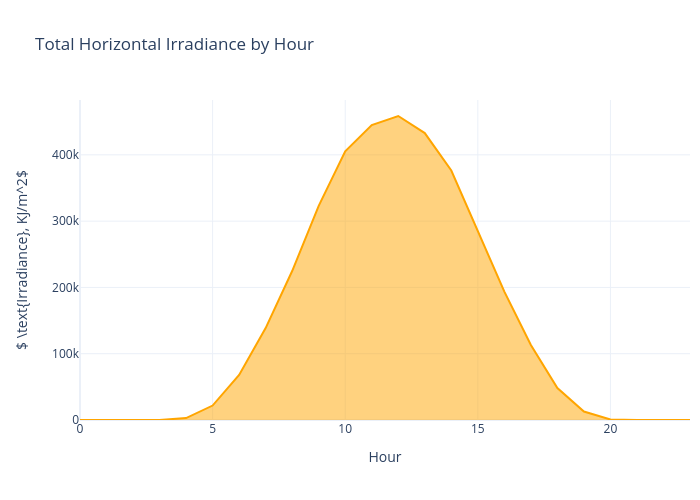
Archy.deberker's interactive graph and data of "Total Horizontal Irradiance by Hour" is a line chart; with Hour in the x-axis and $ \text{Irradiance}, KJ/m^2$ in the y-axis.. The x-axis shows values from 0 to 0. The y-axis shows values from 0 to 0.