Edit chart
Loading graph
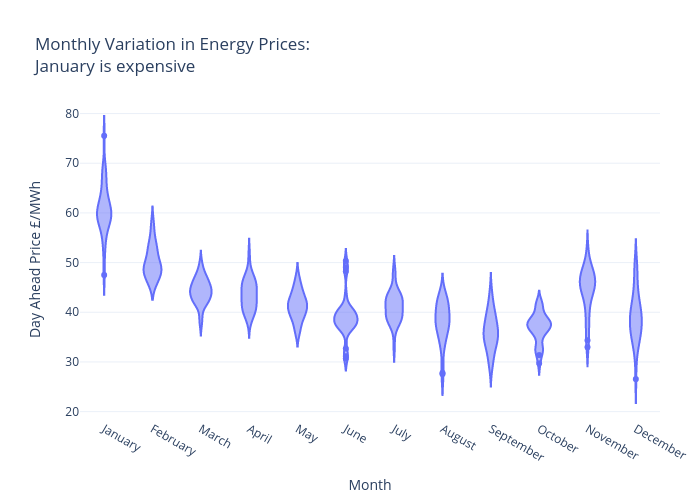
Archy.deberker's interactive graph and data of "Monthly Variation in Energy Prices:January is expensive" is a violin; with Month in the x-axis and Day Ahead Price £/MWh in the y-axis.. The x-axis shows values from 0 to 0. The y-axis shows values from 0 to 0.