Edit chart
Loading graph
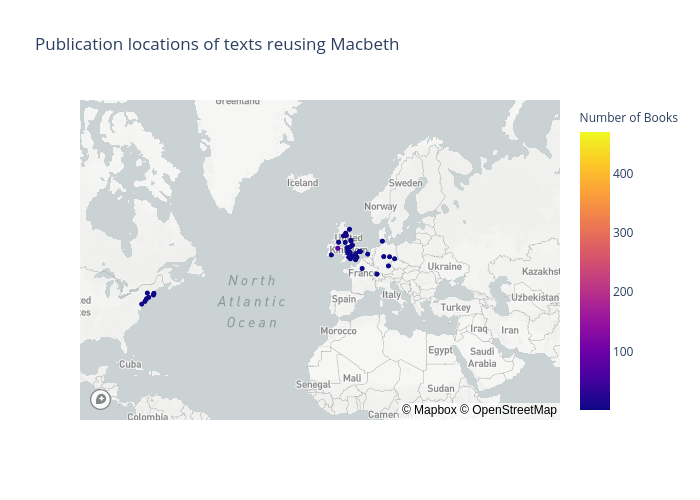
Anttipol's interactive graph and data of "Publication locations of texts reusing Macbeth" is a scattermapbox. The x-axis shows values from 0 to 0. The y-axis shows values from 0 to 0.