Edit chart
Loading graph
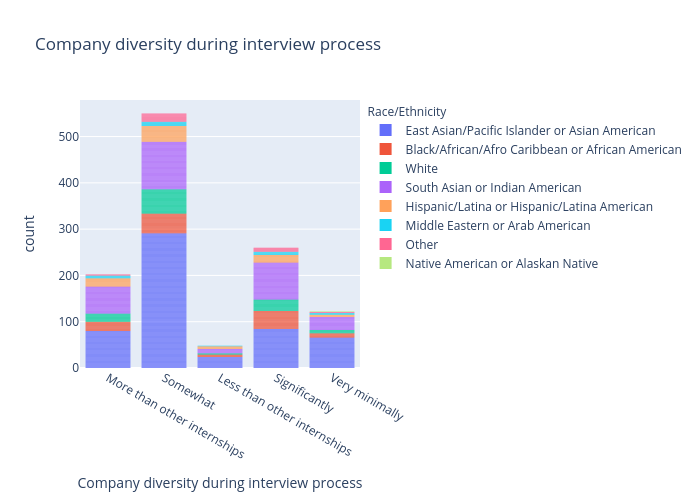
Anoushkatashi's interactive graph and data of "Company diversity during interview process" is a , showing East Asian/Pacific Islander or Asian American, Black/African/Afro Caribbean or African American, White, South Asian or Indian American, Hispanic/Latina or Hispanic/Latina American, Middle Eastern or Arab American, Other, Native American or Alaskan Native; with Company diversity during interview process in the x-axis and count in the y-axis.. The x-axis shows values from 0 to 0. The y-axis shows values from 0 to 0.