Edit chart
Loading graph
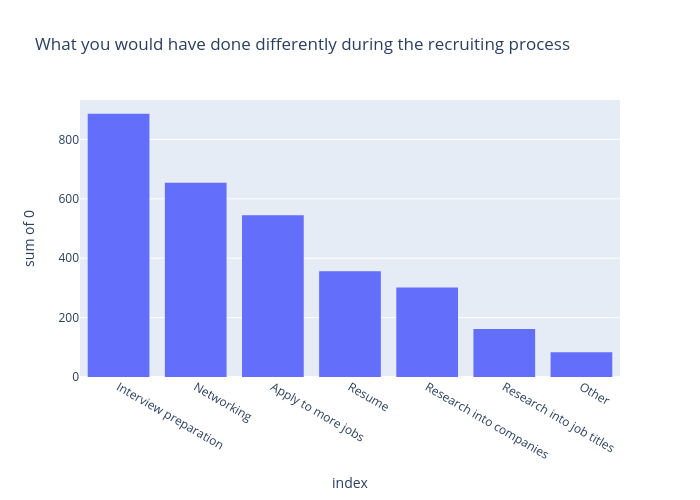
Anoushkatashi's interactive graph and data of "What you would have done differently during the recruiting process" is a histogram; with index in the x-axis and sum of 0 in the y-axis.. The x-axis shows values from 0 to 0. The y-axis shows values from 0 to 0.