Edit chart
Loading graph
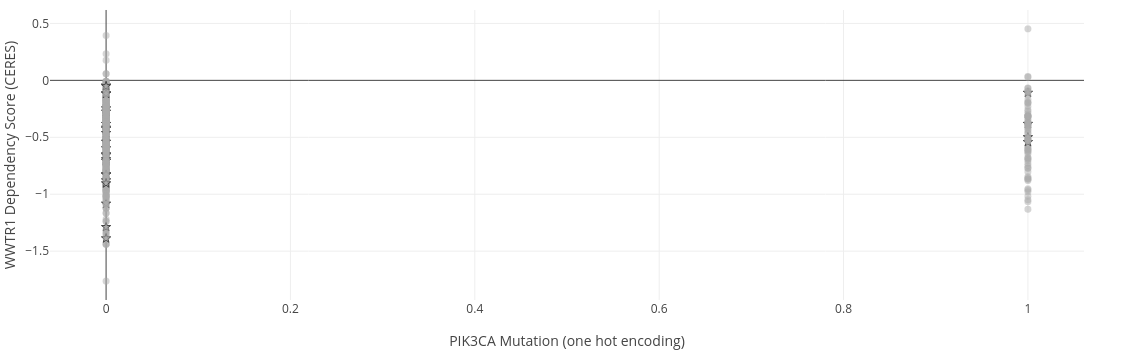
Annie.chai's interactive graph and data of "WWTR1 Dependency Score (CERES) vs PIK3CA Mutation (one hot encoding)" is a scatter chart; with PIK3CA Mutation (one hot encoding) in the x-axis and WWTR1 Dependency Score (CERES) in the y-axis.. The x-axis shows values from -0.06082876823778273 to 1.0608287682377828. The y-axis shows values from -1.9289281377764607 to 0.6177973065428272.