Edit chart
Loading graph
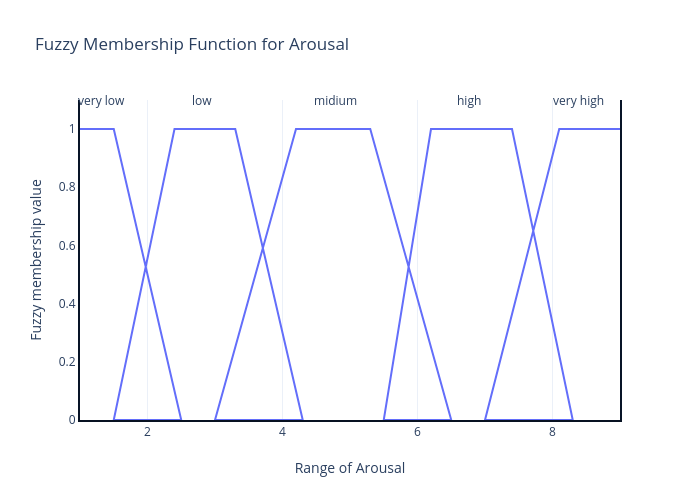
Anjumishra's interactive graph and data of "Fuzzy Membership Function for Arousal" is a line chart; with Range of Arousal in the x-axis and Fuzzy membership value in the y-axis.. The x-axis shows values from 1 to 9. The y-axis shows values from 0 to 1.1. This visualization has the following annotations: very low; low; midium; high; very high