Edit chart
Loading graph
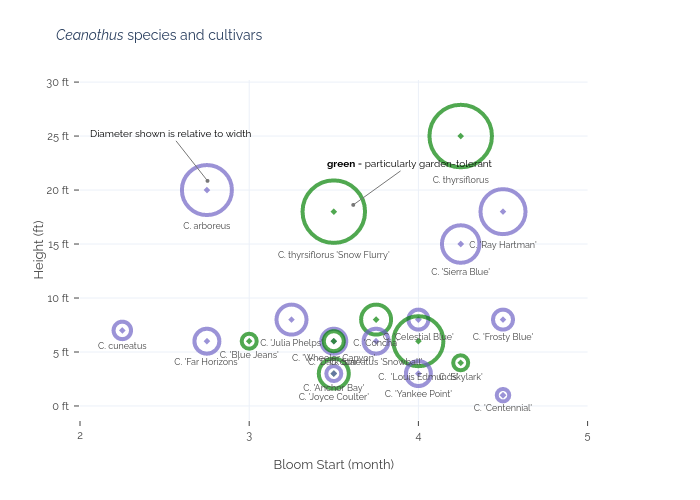
An3perez's interactive graph and data of "Ceanothus species and cultivars" is a , showing Ceanothus Width and Variety; with Bloom Start (month) in the x-axis and Height (ft) in the y-axis.. The x-axis shows values from 2 to 5. The y-axis shows values from -1.0457362684334264 to 29.182945073733705. This visualization has the following annotations: green = particularly garden-tolerant; Diameter shown is relative to width