Edit chart
Loading graph
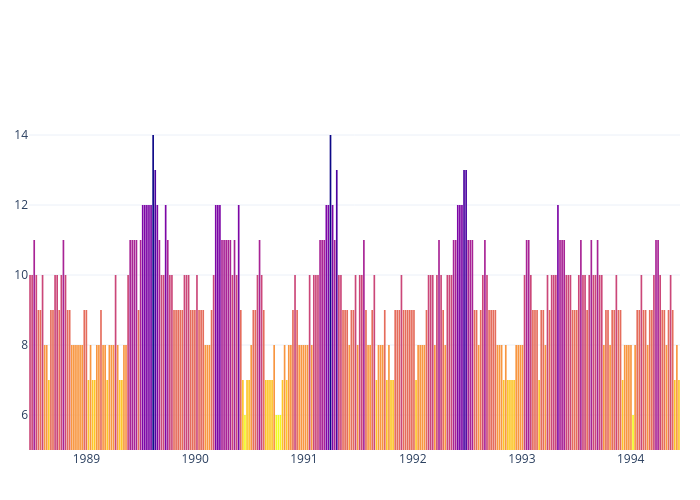
Ampersandamper's interactive graph and data of " " is a bar chart; with in the x-axis and in the y-axis.. The x-axis shows values from 1988-06-22 12:00 to 1994-06-15 12:00. The y-axis shows values from 5 to 15.