Edit chart
Loading graph
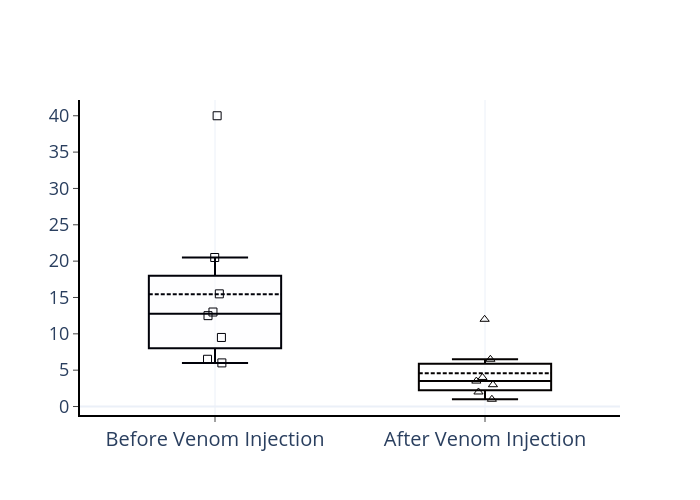
Amitrana94's interactive graph and data of "Before Venom Injection vs After Venom Injection" is a box plot, showing Before Venom Injection vs After Venom Injection; with in the x-axis. The x-axis shows values from -0.5 to 1.5. The y-axis shows values from -1.166666666666667 to 42.166666666666664.