Edit chart
Loading graph
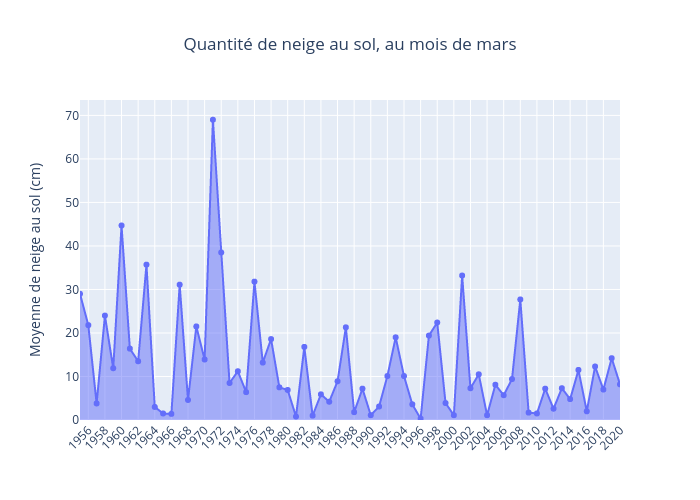
Alisabzi's interactive graph and data of "Quantité de neige au sol, au mois de mars" is a filled line chart, showing mars; with Moyenne de neige au sol (cm) in the y-axis. The x-axis shows values from 0 to 0. The y-axis shows values from 0 to 0.