Edit chart
Loading graph
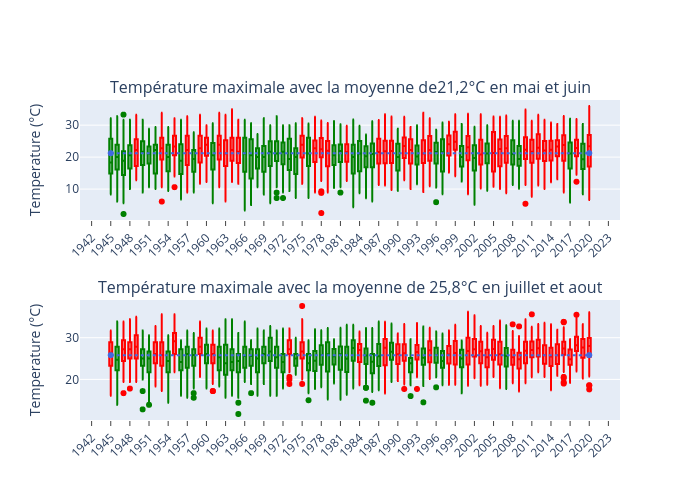
Alisabzi's interactive graph and data is a box plot; with Temperature (°C) in the y-axis. The x-axis shows values from 0 to 0. The y-axis shows values from 0 to 0. This visualization has the following annotations: Température maximale avec la moyenne de21,2°C en mai et juin; Température maximale avec la moyenne de 25,8°C en juillet et aout