Edit chart
Loading graph
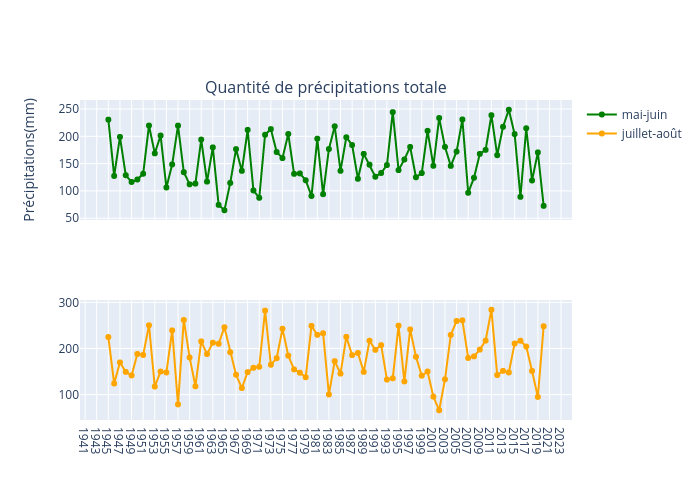
Alisabzi's interactive graph and data of "mai-juin vs juillet-août" is a , showing mai-juin vs juillet-août; with Précipitations(mm) in the y-axis. The x-axis shows values from 0 to 0. The y-axis shows values from 0 to 0. This visualization has the following annotation: Quantité de précipitations totale