Edit chart
Loading graph
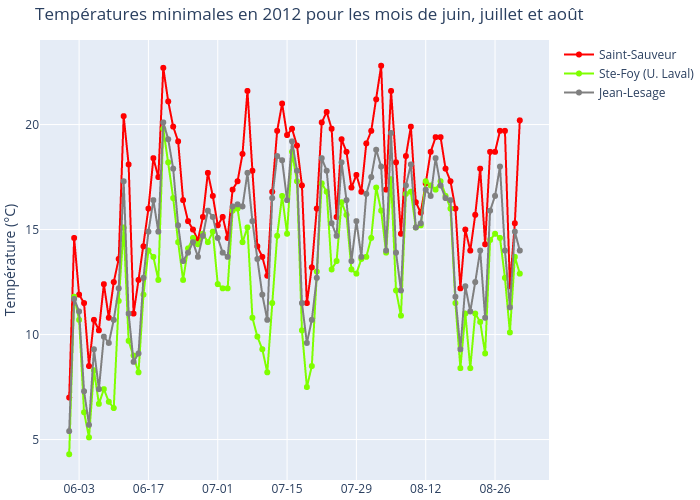
Alisabzi's interactive graph and data of "Températures minimales en 2012 pour les mois de juin, juillet et août" is a line chart, showing Saint-Sauveur, Ste-Foy (U. Laval), Jean-Lesage; with Température (°C) in the y-axis. The x-axis shows values from 0 to 0. The y-axis shows values from 0 to 0.