Edit chart
Loading graph
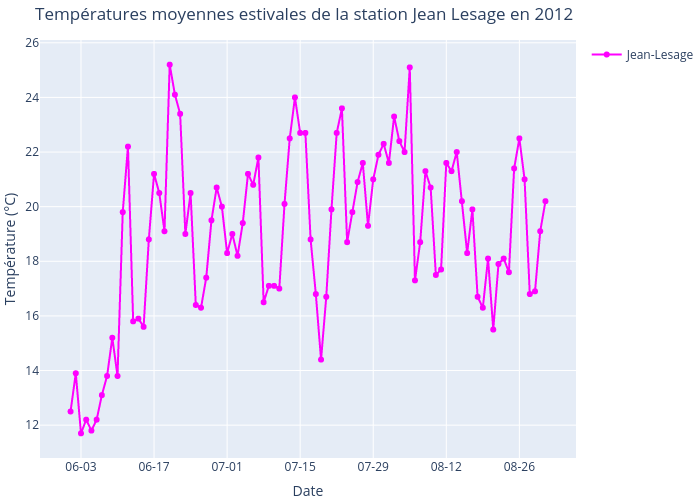
Alisabzi's interactive graph and data of "Températures moyennes estivales de la station Jean Lesage en 2012" is a line chart, showing Jean-Lesage; with Date in the x-axis and Température (°C) in the y-axis.. The x-axis shows values from 0 to 0. The y-axis shows values from 0 to 0.