Edit chart
Loading graph
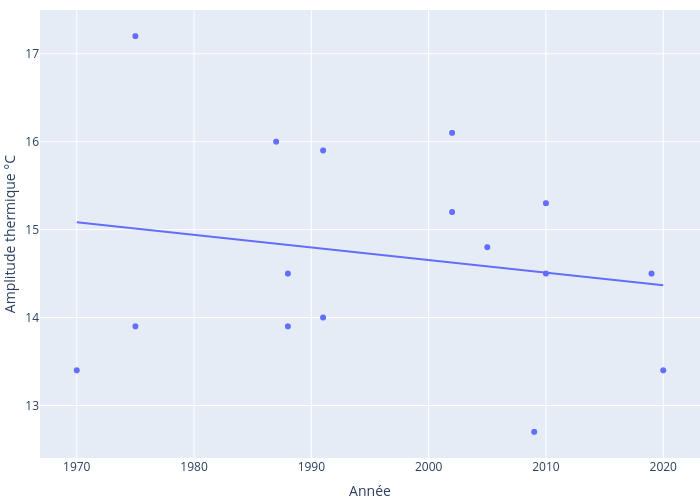
Alisabzi's interactive graph and data of "{'font': {'color': 'black'}}" is a scatter chart, showing vs ; with Année in the x-axis and Amplitude thermique °C in the y-axis.. The x-axis shows values from 0 to 0. The y-axis shows values from 0 to 0.