Edit chart
Loading graph
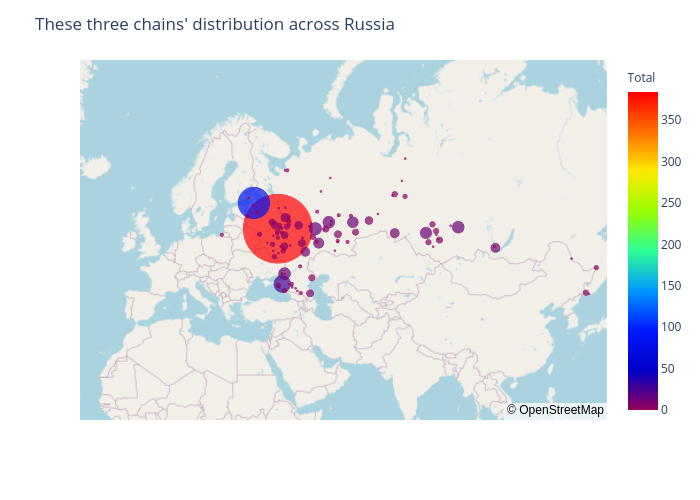
Alexeyzhang's interactive graph and data of "These three chains' distribution across Russia" is a scattermapbox. The x-axis shows values from 0 to 0. The y-axis shows values from 0 to 0.