Edit chart
Loading graph
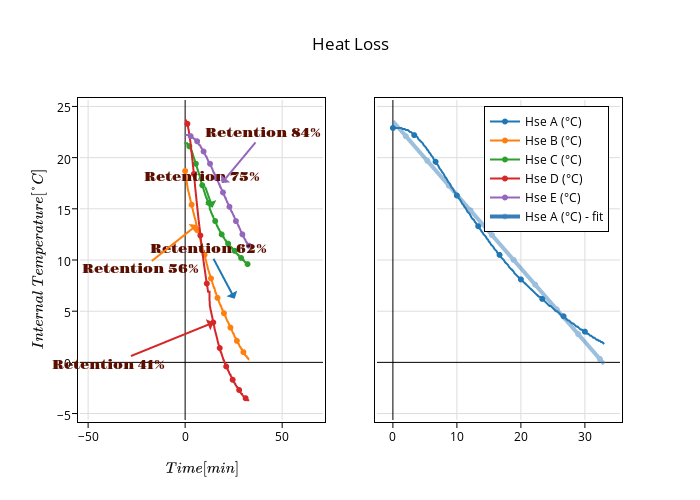
Alex's interactive graph and data of "Heat Loss" is a line chart, showing Hse A (°C), Hse B (°C), Hse C (°C), Hse D (°C), Hse E (°C), Hse A (°C) - fit; with $Time [min]$ in the x-axis and $Internal\;Temperature [°C]$ in the y-axis.. The x-axis shows values from -4.557269107728965 to 35.25084477758472. The y-axis shows values from -5.463080168776371 to 25.463080168776372. This visualization has the following annotations: Retention 62%; Retention 56%; Retention 75%; Retention 41%; Retention 84%