Edit chart
Loading graph
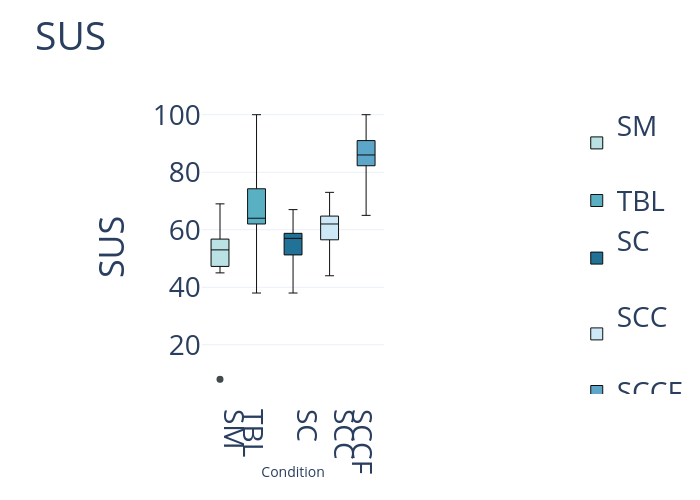
Akshaynayakkolgar97's interactive graph and data of "SUS" is a box plot, showing SM, TBL, SC, SCC, SCCF; with Condition in the x-axis and SUS in the y-axis.. The x-axis shows values from -0.5 to 4.5. The y-axis shows values from 2.8888888888888893 to 105.11111111111111.