Edit chart
Loading graph
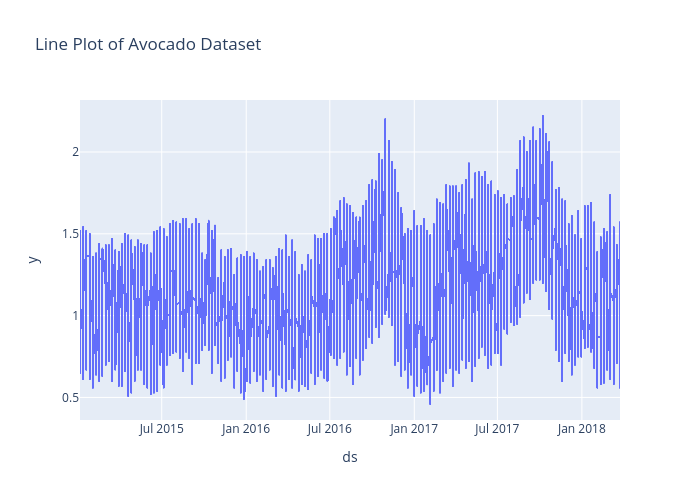
Ai.nileshd's interactive graph and data of "Line Plot of Avocado Dataset" is a scattergl; with ds in the x-axis and y in the y-axis.. The x-axis shows values from 0 to 0. The y-axis shows values from 0 to 0.