Edit chart
Loading graph
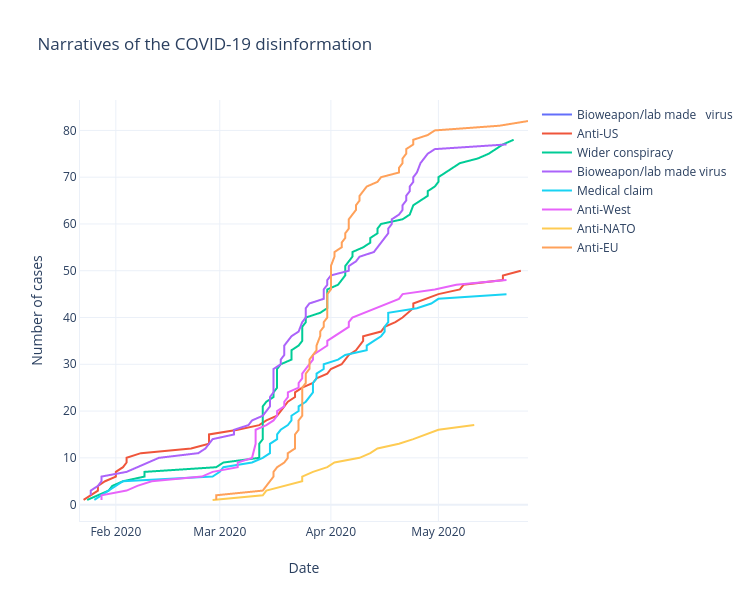
Ahoyle1's interactive graph and data of "Narratives of the COVID-19 disinformation" is a line chart; with Date in the x-axis and Number of cases in the y-axis.. The x-axis shows values from 2020-01-22 to 2020-05-26. The y-axis shows values from -3.500000000000001 to 86.5.